A weekly schedule you can actually read.
Weekly Schedule ManagerCustom
Project overview
STATUS: LIVE — projects.gerber.ca/class_schedule/
The Problem
Academic schedules exist on a frustrating spectrum: at one end, expensive enterprise platforms with far more complexity than most programs need; at the other, spreadsheets that obscure the very patterns they’re meant to make visible. Neither works well for the practical operational questions that faculty, program administrators and schedulers actually ask on a weekly basis: Which rooms are available or at capacity? Which sections are under-enrolled and at risk? Where are instructor conflicts hiding? What does the week actually look like across all delivery modes simultaneously?
In hybrid and multi-modal programs — where some sections run in-person, others via remote instruction, and others asynchronously — the added complexity of tracking delivery mode alongside enrollment and room data makes the spreadsheet approach genuinely untenable. Errors compound invisibly until they surface as conflicts.
The Solution
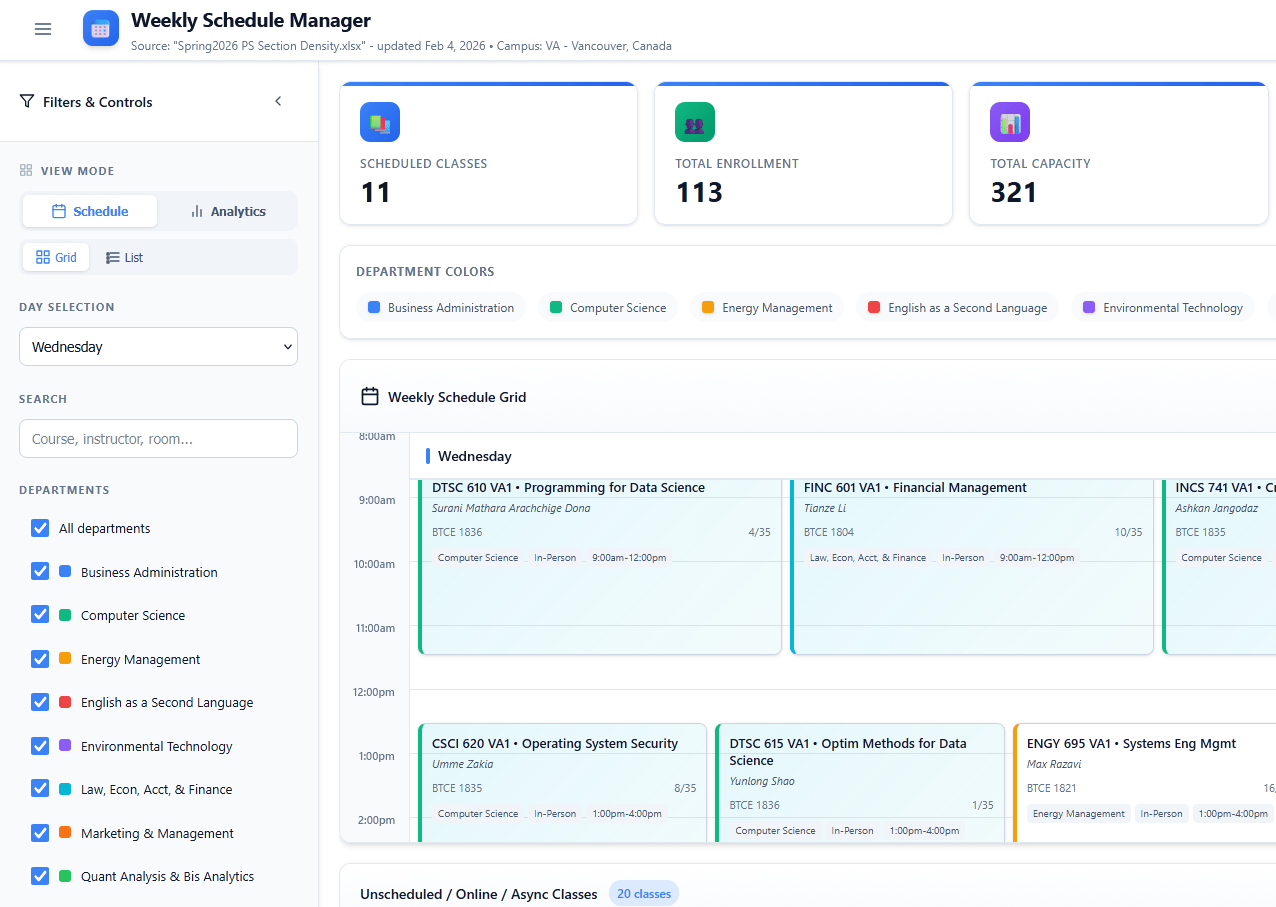
A custom-built interactive dashboard that renders a complete weekly schedule as a colour-coded time-grid — 8:00 AM to 8:00 PM, Monday through Saturday — with each scheduled section displaying its course code, instructor, room or virtual location, enrollment against capacity, department, and delivery mode at a glance. A live summary panel tracks high-level KPIs across the full schedule: total sections, aggregate enrollment and seat capacity, overall fill rate, rooms in active use, peak hours, department distribution, and any room conflict flags. A dedicated panel handles fully online and asynchronous sections that don’t map to physical time slots but still require enrollment and instructor tracking. Schedule data loads via drag-and-drop XLSX or CSV upload, requiring no backend infrastructure — the tool runs entirely in the browser.
Who Uses It
Designed for academic program administrators, department schedulers, and registrar office staff managing course delivery across hybrid and multi-modal programs. The rotation-based structure is directly adaptable to medical residency and clinical training coordination, where the same scheduling logic applies to supervising physician availability, rotation site assignments, and learner capacity tracking across hospital sites.
What Changed
The shift from spreadsheet-based scheduling to the dashboard view changes the nature of the administrative conversation: instead of asking “what does the data say?” participants can see the answer instantly and redirect attention to the decisions the data should inform. Under-enrolled sections that previously went unnoticed until the add/drop deadline become visible in week one. Room conflicts that accumulated silently in spreadsheet formulas are flagged in real time. The tool has also been useful as a demonstration instrument in discussions with health authorities and hospital partners about rotation scheduling capacity — providing a concrete, interactive visualisation of planning complexity that static documents cannot replicate.
- Weekly grid (Mon–Sat) with course/section, instructor, room, enrollment/capacity, mode.
- Summary dashboard metrics (counts, totals, utilization signals).
- Dedicated list for online/async/room-unassigned entries.
- Upload/refresh support for XLSX/CSV to update term data.

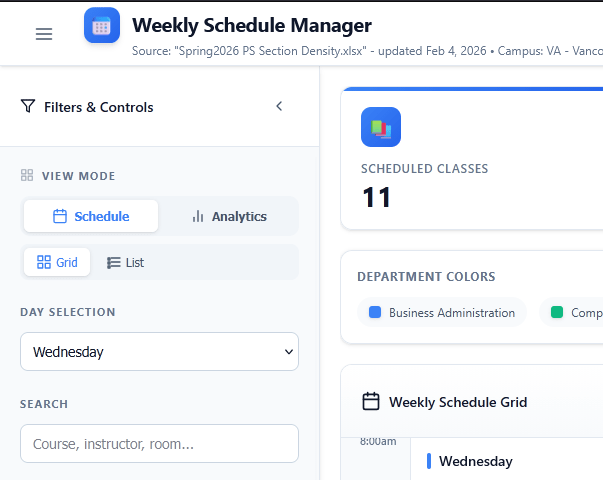
ScheduleFilters
ScheduleView
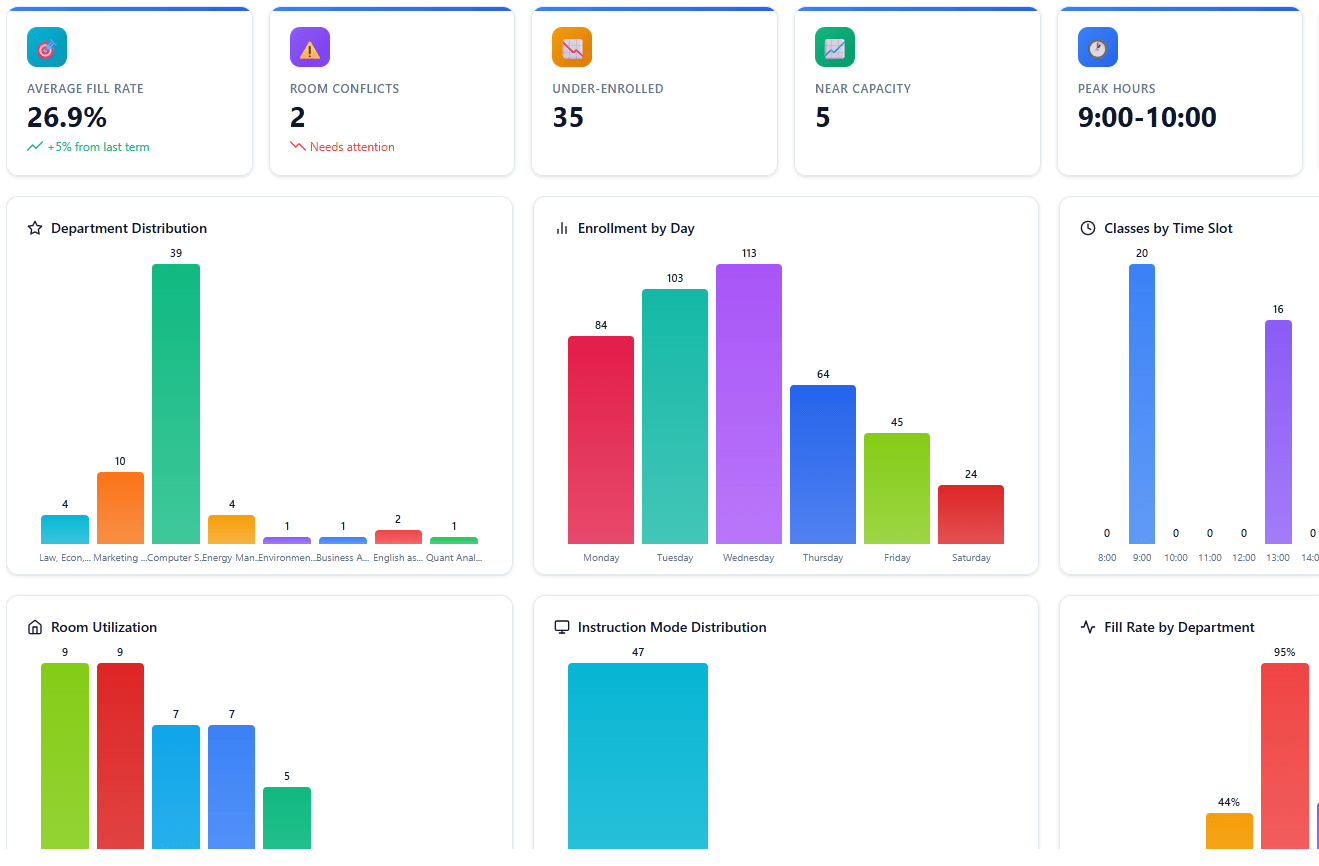
ScheduleAnalytics
- Makes patterns visible quickly (conflicts, underfilled sections, peak hours).
- Reduces time lost to “where is that information?” moments.
- Data visualization
- Web UI
- Spreadsheet import / app save
From endless tables to an interface that makes sense (pull the slider)👇

Live Demo (demo data)
01


0 Comments